Traffic overview
Your Google traffic: the four tabs, period and sync, connecting Google, and the Overview tab section by section.
Traffic shows "how many people reach your site from Google, and what changed." Its numbers come from Google Search Console and Google Analytics 4, which you connect in Settings › Integrations Professional and up.
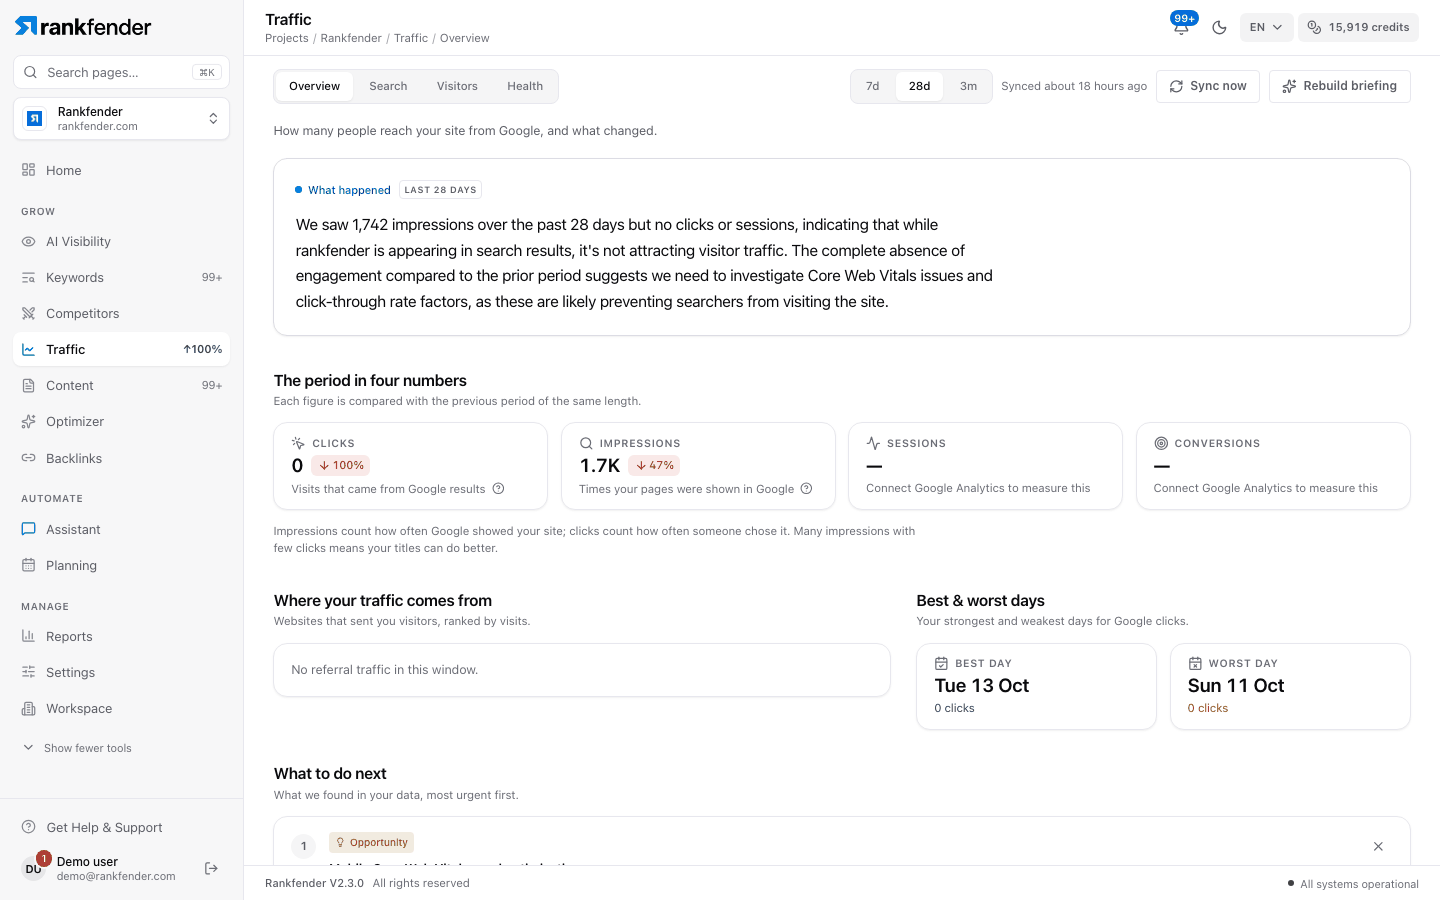
The four tabs
| Tab | What it shows | Source |
|---|---|---|
| Overview | The period in one page: what happened, four key numbers, where visitors come from, what to do next. | Search Console + GA4 |
| Search | Clicks, impressions, CTR and position, by search and by page. | Search Console |
| Visitors | Sessions, engagement and conversions, by channel and landing page. | GA4 |
| Health | What is wrong or worth fixing: technical checks, opportunities, problems. | Search Console + GA4 |
Coming soon
Six more tabs are announced: AI traffic, Earned, Bing & Copilot, Value, AI crawlers and Goals. They are not in the tab bar yet; an old link to one of them opens a "Coming soon" page that describes what it will show.
Period and sync
- 7d / 28d / 3m: the period for every tab. 28 days is the default.
- "Synced …": when Rankfender last received data from Google.
- Sync now: asks Google for the latest days (the last 7, or 90 on a first sync) from Search Console and GA4. It uses no credits.
- Rebuild briefing (Overview): writes the period summary again with AI. It uses credits.
First time
Connect Google
In Settings › Integrations, press Connect on the Google card and pick your Search Console property and, if you have one, your GA4 property.Wait 24–48 hours
Traffic says "Google sends data once a day — first numbers within 24–48 h". Your last 16 months are imported; the page fills in by itself.Come back to Overview
Pick a period and read the summary.
Before Google is connected, Traffic shows "What you'll see" and a button to Settings › Integrations. Home's "Organic search" card works without Google; see Organic search and AI answers.
The Overview tab
| Section | What it shows |
|---|---|
| What happened | A short summary of the period, written by AI from your data and built every night. If there is none yet: "Build the briefing". |
| The period in four numbers | Clicks and Impressions (Search Console), Sessions and Conversions (GA4), each compared with the previous period of the same length. Without GA4: "Connect Google Analytics to measure this". |
| Where your traffic comes from | Websites that sent you visitors, ranked by visits (GA4). |
| Best & worst days | Your strongest and weakest days for Google clicks. |
| What to do next | What Rankfender found in your data, most urgent first. |
| Right now | Live visitors (people on your site in the last 30 minutes, GA4) and Site health (page speed: Passing, Needs work or Failing). "Open Health" opens the Health tab. |
Acting on a finding
Each finding in "What to do next" is tagged Critical, Opportunity or Observation. It explains "Why it matters" and lists the Pages and Queries it affects.
- Dismiss hides it. Useful / Not useful tells us if it helped.
- A suggested action opens "Send this to" Content, Optimizer or Keywords. Send logs the action as taken and takes you there.